
Cloud Monitoring
Support for Reliable Operation of Cloud Infrastructure
Overview


-
Reliable Computing Resource Management
Users can easily check indexes on the usage of CPU, disk, and memory. The automatic notifications to designated recipients of an event in the resources being used enable swift failure analysis and responses, supporting reliable operation of computing resources.
-
Convenient Monitoring
Dashboards are provided to monitor the status of resources. Both basic dashboards for each account and user-defined ones are available with various widget settings that enable easy and fast dashboard creation.
-
Event Index Management
A web-based console helps set event indexes with just a few clicks. The setting for monitoring targets (event pattern, necessary condition/cycle, performance index, operation status, etc.) may be edited according to the environment and managed with threshold and notification settings.
-
Resource Log Management
Log data of resources are collected/stored and searching for a specific log is also available. Events for major keywords are indexed to automatically notify designated personnel if the pre-determined conditions are met and offer more reliable environments.
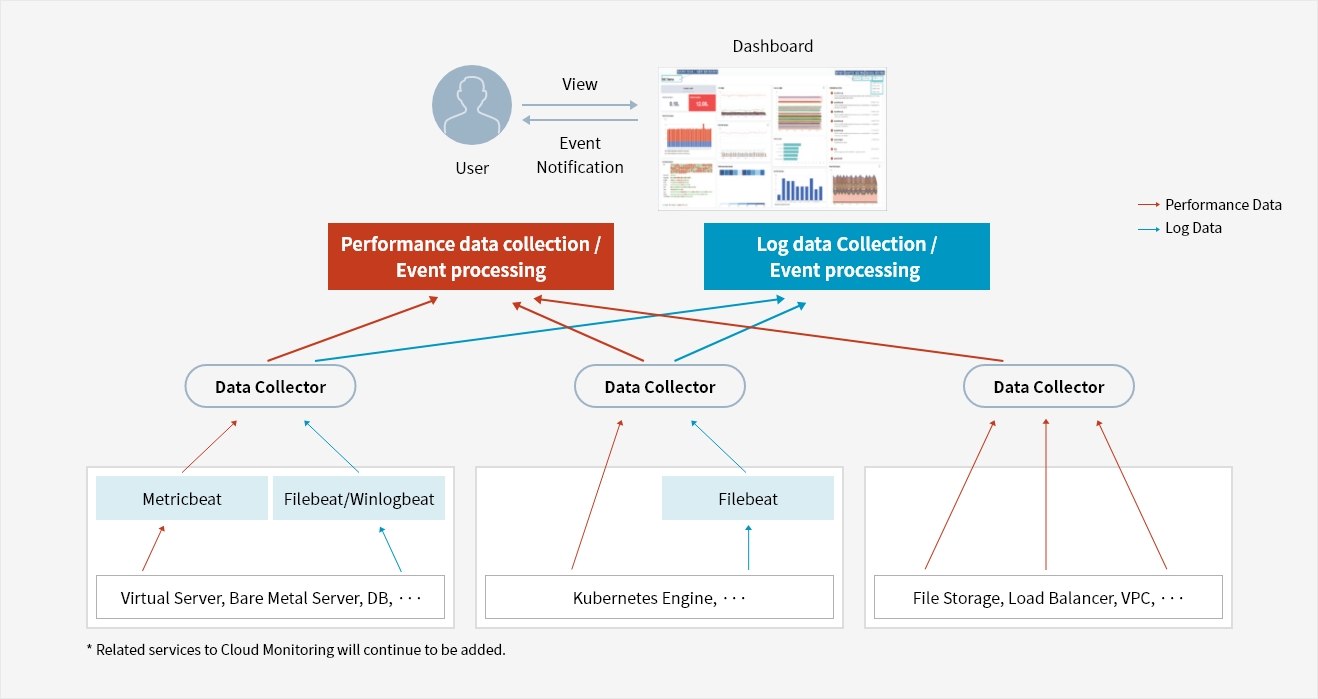
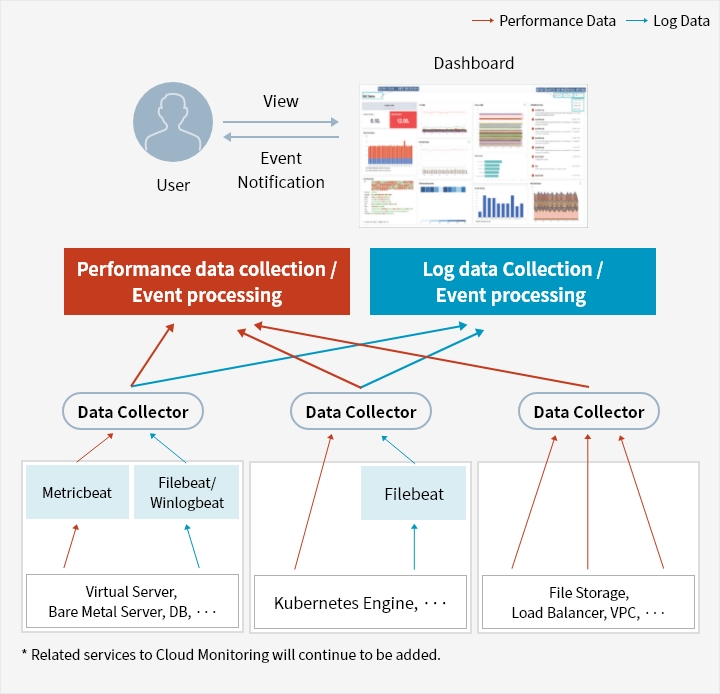
Service Architecture
| Zone | Component | Description |
|---|---|---|
| User Interface | User | The user views monitoring data via the Dashboard and receives Event Notifications in return. |
| Dashboard | A monitoring dashboard displaying charts and metrics. The user can view data and receive event-based alerts from this interface. | |
| Data Processing | Performance Data Collection / Event Processing | Collects performance metrics (red arrows) from all Data Collectors and processes events accordingly. |
| Log Data Collection / Event Processing | Collects log data (blue arrows) from all Data Collectors and processes events accordingly. | |
| Data Collector 1 | Data Collector | Aggregates both performance data and log data from underlying agents and forwards them to the respective processing engines. |
| Metricbeat | Collects performance metrics from Virtual Server, Bare Metal Server, DB, and other infrastructure resources. | |
| Filebeat / Winlogbeat | Collects log data from Virtual Server, Bare Metal Server, DB, and other infrastructure resources. | |
| Source: Virtual Server, Bare Metal Server, DB | Infrastructure resources monitored by Data Collector 1 via Metricbeat and Filebeat/Winlogbeat agents. | |
| Data Collector 2 | Data Collector | Aggregates both performance data and log data from the Kubernetes Engine and forwards them to the respective processing engines. |
| Filebeat | Collects log data from the Kubernetes Engine. | |
| Source: Kubernetes Engine | Container orchestration infrastructure monitored by Data Collector 2 via Filebeat. | |
| Data Collector 3 | Data Collector | Aggregates both performance data and log data from storage and network resources and forwards them to the respective processing engines. |
| Source: File Storage, Load Balancer, VPC | Storage and network infrastructure resources monitored directly by Data Collector 3. | |
| Note | Additional Services | Related services to Cloud Monitoring will continue to be added. |
Key Features
-
Integrated dashboard creation/management
- Account dashboard : Number of key services, operation status (running/down), number of events by risk category (fatal/ warning /information), and top 5 performance (CPU, memory, and storage), event maps, and unresolved event list
- User-defined dashboard
· Basic widgets : Title, event list (resolved/unresolved), operation status, event status, etc.
· User widgets : Time series graphs by service/collection item, comparison charts, status index, instance maps (events), etc.
-
Event/notification management
- Select event index : Event patterns, scheduling, conditions, target data, etc.
- Set custom defined events : Monitoring targets, risk, performance items, event rules, etc.
- Manage notification contacts and event notification types(email, SMS, etc.)
-
Log monitoring
- View logs by account : Cumulative number of logs, number and cumulative rate of daily logs, and number of logs for each target
- Collect/store/search logs(1GB storage included)
- Export searched log data(Excel files)
- Index search keyword events and send notifications


Whether you’re looking for a specific business solution or just need some questions answered, we’re here to help