
ServiceWatch
Monitoring the Performance and Operational Status of Resources
Overview


-
Monitoring Resources
Collect and visualize performance metrics of resources(such as CPU utilization) in real time. Create a dashboard that allows you to visually view multiple metrics to get a quick view of the status of your resources. Provides a user dashboard for users to select monitoring metrics and a service dashboard that is automatically created for each service.
-
Alert Policy Settings and Notifications
Users can create policies by setting conditions and thresholds in advance. When the threshold is exceeded, notifications can be automatically received, allowing users to quickly check and respond to the status of their resources.
-
Analysis and Storage of Logs
Logs generated from resources can be collected and viewed easily. The collected logs are kept in a log group and managed. Each log group can be stored free of charge up to 5GB per region. Log archival policies can be set up to automatically delete logs that are past their archival period, enabling efficient log storage management.
-
Cost Efficiency
ServiceWatch provides a flexible pricing plan that costs you as much as you use it, making it cost-effective. In addition, by providing a free section, you can try it first for free and expand the storage period and capacity for a fee as much as you need.
Service Architecture
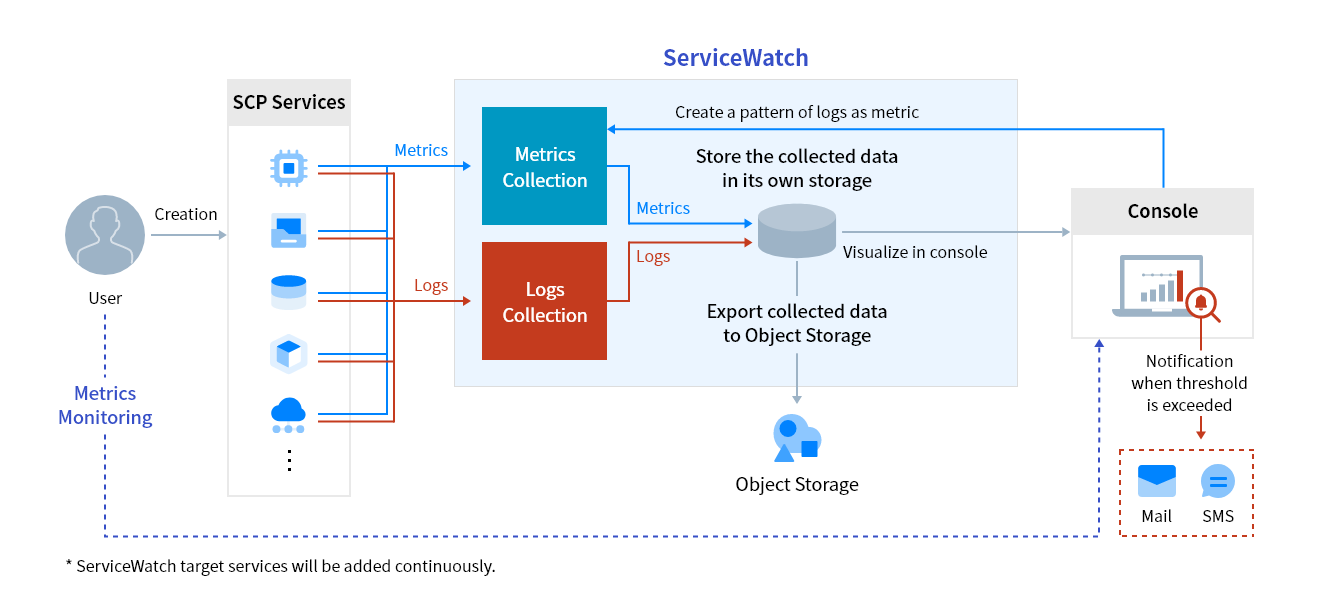
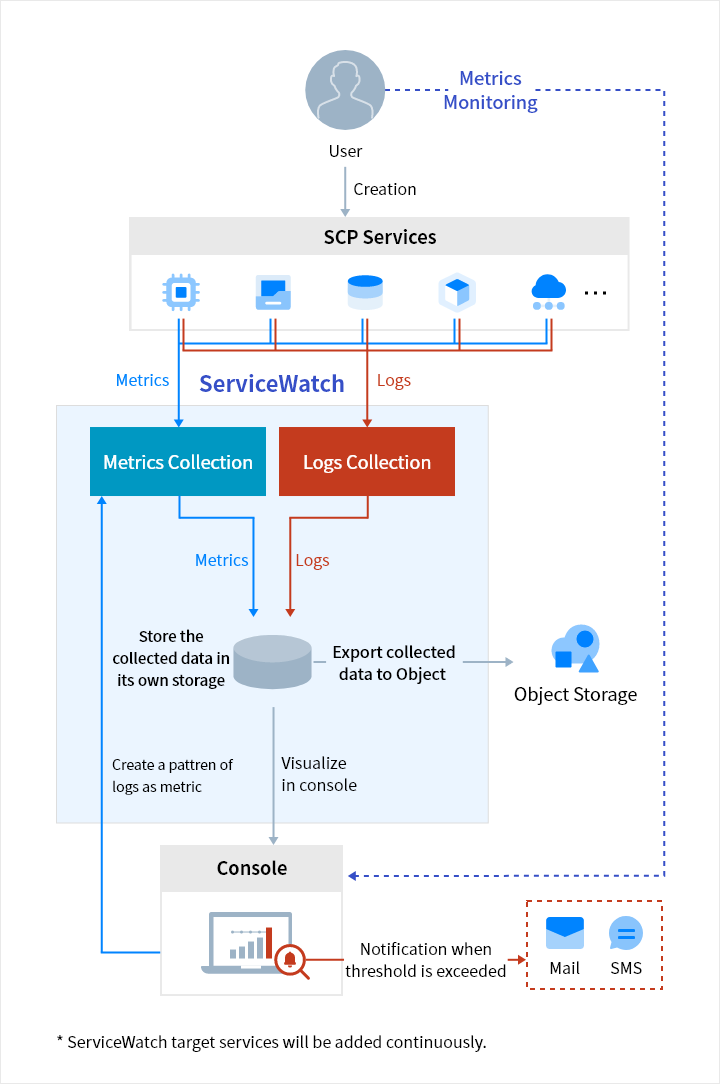
User → Creation → SCP Services → Logs → ServiceWatch[Log Collection → Logs → Export collected data to Object Storage → Object Storage, Logs → Visualize in console → Console
Console → Create a pattern of logs as metric→ Metrics Collection
User → Metrics Monitoring → Console
Console → Notification when threshold is exceeded → Mail, SMS *ServiceWatch target services will be added continuously.
Key Features
-
Metrics monitoring
- Collect and store metric data for performance monitoring of SCP resources
- Visualize metrics in a single region through the dashboard to provide an integrated view of resources
- User-defined thresholds can be set to see changes in metrics
- Provides the ability to specify notification recipients when thresholds are exceeded
-
Logs monitoring
- Manage collected logs as log groups
- Archive policies can be set per log group
- Store log groups in Object Storage for convenient management
-
Create event rules
- Set notifications by creating system event rules for resource changes
- Specify notification recipients based on event rules
-
Custom metrics
- ServiceWatch collects monitoring metrics provided by SCP resources and custom metrics and logs .
- Install ServiceWatch agent on resources such as Virtual Server, GPU Server, and Bare Metal Server to collect custom metrics and logs
- Use OpenAPI/CLI from ServiceWatch to collect custom metrics and logs


Whether you’re looking for a specific business solution or just need some questions answered, we’re here to help