
Elasticsearch
Elasticsearch is an open source search engine solution developed and delivered by Elastic Co., Ltd. based on Apache Lucene. Lucene is equipped with a powerful search function, but since it is provided in the form of a library, we have to develop a lot of it ourselves when applied..On the other hand, Elasticsearch supports most of the functions of Lucene, can process large amounts of data, and is easy to install and configure.
Elasticsearch, which has been positioned as a leading enterprise search engine since its release in 2010, is evolving into an integrated brand called Elastic Stack, combining various solutions centering on search functions. Elastic Stack is an open source software suite that allows users to retrieve, analyze, monitor, and visualize data in real time by fetching data from a server. It consists of logstash (collects data using various plugins), beats (a lightweight data transmitter), elasticsearch (a distributed search engine), and kibana (a data visualization tool).
 [Figure 1] Elasitc Stack
Recently, Elastic is expanding its solution portfolio into three areas: Search, Observability and Security. It is based on the Elastic Stack and plans to provide products and services that meet market needs by developing additional products in-house or merging external ones into the stack. We will take a look at the Elasticsearch search engine, the central axis of the Elastic Stack, from the above three perspectives mainly.
Search
Retrieval to search queries
In Elasticsearch, a single unit of data is called a document, and the collection of these documents is called an index. Elasticsearch secures documents for search and aggregation by going through a process called indexing when data comes in. To dive deeper into this process, we need to understand the process for extracting search terms during indexing, called Analysis. Analysis consists of Character Filter-Tokenizer-Token Filter and is executed in an orderly manner.
•Character filter converts the input original data, such as deleting or changing unnecessary data, into the form required for analysis.
•Tokenizer splits it into keyword data needed to be used as basic data for search.
•Token Filter ends the analysis process leaving only essential data, such as deleting unnecessary data generated during the tokenizer operation or changing all English letters to lowercase letters and so forth.
 An analyzer consists of three things; character filters, token filters, and a tokenizer. An analyzer is basically a package of these building blocks, with each one of them changing the input stream.
[Figure 2] Analysis Process
An analyzer consists of three things; character filters, token filters, and a tokenizer. An analyzer is basically a package of these building blocks, with each one of them changing the input stream.
[Figure 2] Analysis Process(Source: https://codingexplained.com/coding/Elasticsearch/understanding-analysis-in-Elasticsearch-analyzers)
Like most foreign software, Elasticsearch also has a function for indexing English letters and numbers, but support for the ones of non-English languages such as Korean is somewhat weak. Fortunately, in 2018, a Korean analyzer called Nori was provided to improve search speed and functionality, but there are still areas that need more detailed support.
Retrieval to aggregation queries
Unlike search queries, aggregation and answer data for sorting (arranged according to certain conditions) queries are indexed through a built-in keyword type field and stored in doc_value. doc_value is the default cache used by Elasticsearch. Instead of indexing documents loaded in memory for efficient memory management, doc_value is stored on disk along with index data and its value is used. Because the data is stored in a column-oriented way, quick answers are possible. Therefore, a field called keyword should be used for aggregation and sorting queries whenever possible.
It is true that we can do aggregation and sort queries on the analyzed field without using the keyword field. However, to do this, after enabling the Use Fielddata option, a significant amount of memory is used to answer the first query, fetching values from the analyzed data, and then storing the data for aggregation and sorting in the field data. It should be noted that this field data resides in the JAVA Heap memory, so it may cause out-of-memory, and this is the reason Elasticsearch introduced keyword fields after many version upgrades.
One notable thing in response to Search is its speed. As indices, which are a set of documents, are separated into units called shards and stored distributed in each node, Elasticsearch takes on the aspect of a well-distributed system. Because of this, even a large number of queries are answered, in a prompt way, based on the top data distributed across each local shard rather than the entire global shards with the same relevance in large datasets especially. If we need to respond based on the entire data, however, it might be supported as an option, and we might take into account that the speed of the response may be reduced.
As such, Elasticsearch is attracting a lot of attention in the market because it has technical characteristics to process large-scale data search at high speed. According to DB-Engines Ranking, which ranks monthly by evaluating DBMS-related popularity, Elasticsearch ranks first among 21 solutions surveyed in the search engine field as of July 2020.
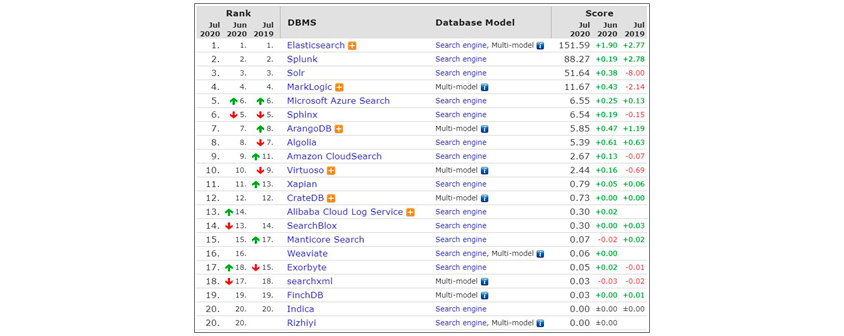 DB-Engines Ranking of Search Engines July, 2020. 1st Elastic Search, 2nd Splunk, 3rd Solr, 4th MarkLogic, 5th Microsoft Azure Search, 6th Sphinx, 7th ArangoDB, 8th Algolia, 9th Amazon Cloud Search, 10th Virtuoso, 11th Xaoian, 12th CrateDB, 13th Alibaba Cloud Log Service, 14th SearchBlox, 15th Manticore Search, 16th Weaviate, 17th Exobyte, 18th searchxml, 19th Finch DB, 20th Indica, Rizhiyi
[Figure 3] DB-Engines search engine ranking (July 2020)
DB-Engines Ranking of Search Engines July, 2020. 1st Elastic Search, 2nd Splunk, 3rd Solr, 4th MarkLogic, 5th Microsoft Azure Search, 6th Sphinx, 7th ArangoDB, 8th Algolia, 9th Amazon Cloud Search, 10th Virtuoso, 11th Xaoian, 12th CrateDB, 13th Alibaba Cloud Log Service, 14th SearchBlox, 15th Manticore Search, 16th Weaviate, 17th Exobyte, 18th searchxml, 19th Finch DB, 20th Indica, Rizhiyi
[Figure 3] DB-Engines search engine ranking (July 2020)(Source: https://db-engines.com/en/ranking/search+engine)
Observability
Putting aside search data that includes human languages, most data journeys related to Observability and Security may seem to be starting with machine (computing device) data. And we need to understand the importance of machine data for a moment. Since machine data is informational data, accuracy as well as up-to-dateness are important. Therefore, informational data without creation time may not be significant in terms of utility and usability. If we do not have time-series data, we will have to consider once again whether to use Elasticsearch in terms of Observability and Security.
 [Figure 4] Observability main components
(Source: https://www.elastic.co/blog/observability-with-the-elastic-stack)
As shown in [Figure 4], Observability consists of three functions: Logs, Metrics, and APM (Application Performance Management).
•Logs: Understood and accepted as data generated whenever an event occurs on the machine.
•Metrics: Understood and accepted as measurement data created by measuring the machine at regular intervals.
•APM: Aggregates and tracks data received through Logs and Metrics to facilitate performance analysis of running applications.
Elasticsearch's Observability can be seen as performing its function through visualization in terms of data life cycle based on machine data. Elasticsearch provides Index Lifecycle Management (ILM) for time series machine data, allowing us to manage hot, warm, cold, and delete indexes according to policies. An example of a log collection system is as follows:
•Today's logs are being actively indexed, and this week's logs are the most searched. → Hot
•Last week's logs are searched, but not as often as this week's logs. → Warm
•The last month's log may not be searched very often, but it's a good idea to keep it in case. → Cold
•Logs from the previous month are no longer needed, so we can delete them. → Delete
 [Figure 5] Data placement within nodes according to the data lifecycle
(Source: https://www.elastic.co/blog/implementing-hot-warm-cold-in-Elasticsearch-with-index-lifecycle-management)
By disposing data differently based on the up-to-dateness, it prevents performance degradation when searching and processing statistics caused by large amounts of data, reduces storage costs, and improves data reliability. Based on accumulated data, Kibana is in charge of visualization that helps us to tell insights and stories. Kibana started as a user interface(UI) tool for data visualization of Elasticsearch and has become an important axis of the Elastic Stack as it has been extended to Elastic Stack administrator functions. To use Kibana, we first need to set an index pattern. The index pattern informs Kibana of the Elasticsearch index that the user wants to investigate. We can create an index pattern for a specific index, just select the index pattern when searching for data or running a visualization.
Kibana application consists of three main menus: Discover, Visualize, and Dashboard. Discover is a tool that allows us to search or filter the original document. We can check the structured appearance of the collected data, search for necessary data, and simple statistics of the data that make up the field.
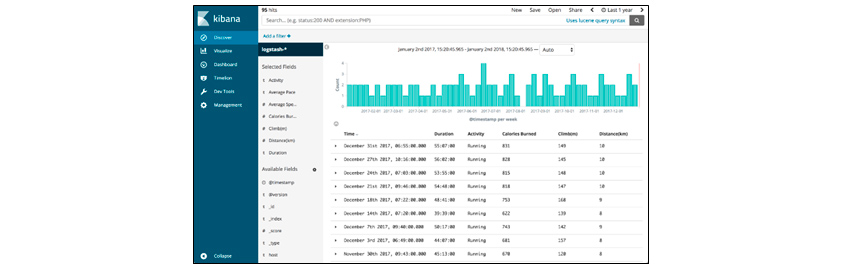 [Figure 6] Kibana's Discover Menu Screen
(Source: https://logz.io/blog/runkeeper-elk-stack)
Visualize visualizes and displays accumulated data in various formats, such as bar graphs, pie charts, tile maps, and maps. Generated graphs and charts support embedded code for use in systems other than Kibana. When data changes, we can select either a saved object that is reflected in graphs and charts, or a snapshot that does not apply the changes.
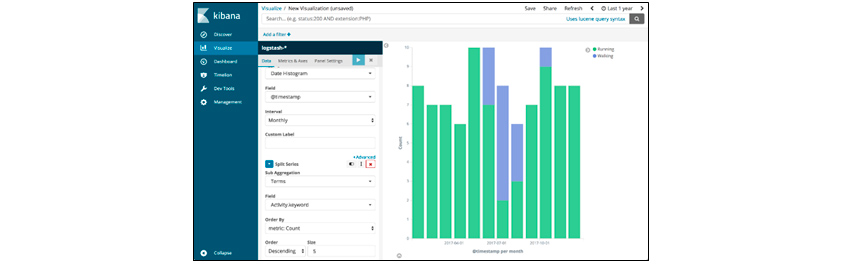 [Figure 7] Kibana's Visualize Menu Screen
(Source: https://logz.io/blog/runkeeper-elk-stack)
Dashboard collects objects visualized through Visualize and allows them to be viewed on a single screen. We can drill down on problems and specifics under various conditions that meet the data creation time and use case. This is an important function that helps us intuitively check debugging or problems through APM in operation and development. In the detection of anomalies in Elasticsearch Machine Learning, if it is out of general normal conditions, we can point the problem out through visualize and dashboard and take a prompt action.
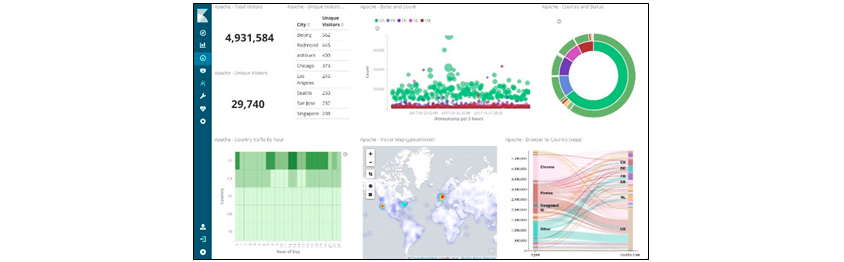 [Figure 8] Kibana's Dashboard Menu Screen
(Source: https://towardsdatascience.com/an-overview-on-Elasticsearch-and-its-usage-e26df1d1d24a)
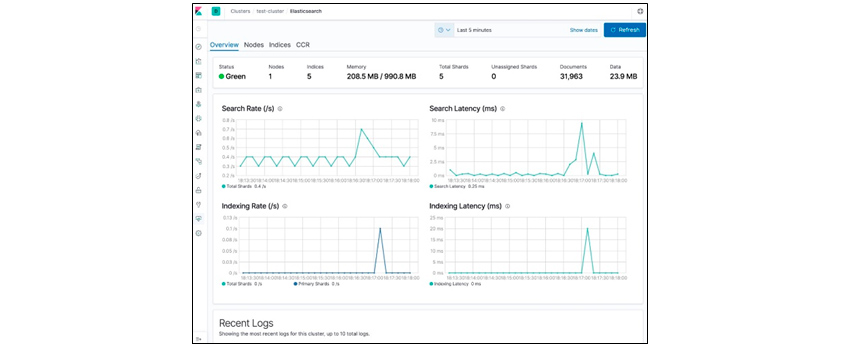
In addition to Discover, Visualize, and Dashboard, Kibana can monitor each cluster and node of Elasticsearch. This status data is periodically collected from each node, and by setting a threshold, we can receive notifications by e-mail, etc. when a risk occurs, or we can quickly respond without human intervention by running an automatic script through a webhook for instance.
 [Figure 9] Kibana's Monitoring Menu Screen
(Source: https://www.elastic.co/guide/en/kibana/current/Elasticsearch-metrics.html)
Security
Elasticsearch mounts security information and event management (SIEM) solutions on Kibana to proactively defend and take action against external system attacks or anomalies. Since this part requires an understanding of Elasticsearch SIEM based on various use cases, we will discuss it in detail in the next opportunity, and this time, we will look at the authentications and authorizations of Elasticsearch.
In order to protect the data transmitted through Elasticsearch from unauthorized user access and unintentional modification, the first thing that must be established is the authentication process. Elasticsearch can integrate with external industry standard identity management systems. User authentication is possible with Active Directory, LDAP or Elasticsearch native realm.
In addition, it supports authority management through RBAC (Role Based Access Control), which controls access based on the roles assigned to users, and ABAC (Attribute Based Access Control), which controls access using the attributes of the security target. For document-level security, additional query statements that can identify the document must be entered. Prior knowledge of Elasticsearch queries may be required in here, though.
ABAC can perform more granular rights management than RBAC by using attributes. When creating or changing a user, document access is managed through a query between the properties set using the template query and the properties of the document mapping field. Therefore, the design of attributes and authorization policies based on them is very important and may require additional user interface development for rights management. It is important to keep in mind that there are various ABAC solutions on the market, and Elasticsearch provides basic functions for ABAC, not ABAC solutions.
Elasticsearch supports TLS (Transport Layer Security) within the cluster for data communication security, and SSL (Secure Sockets Layer) for data communication inside and outside the cluster. We can use certificates from our own private certificate authority for SSL (with the help of Elasticsearch built-in feature of certutil), as well as certificates from public certificate authorities. However, in the case of a private certificate, it should be taken into account that a message indicating an insecure site is displayed when accessing via https from outside. In addition, Elasticsearch also provides the Space function, which allows users to set whether to access the dashboard, visualize, and other stored objects by granting space rights for each user.
Things to consider when introducing
Subscription for business needs
As mentioned earlier, Elasticsearch is equipped with a variety of software for Search, Observability, and Security, and provides Basic Subscription for free use of basic functions. Therefore, from a user's point of view, it is easy to think that this basic subscription alone will be able to build a search system without difficulty. However, if we look at the cases of Elasticsearch in real companies, we can see that there are limitations with basic one. Company A, a global steel manufacturer, switched to Elasticsearch while using a search solution of another company. Platinum Subscription, a paid technology service, was made to secure data security, large data connection, and system stability.
Professional technical supports
Since Elasticsearch runs in a Java Virtual Machine (JVM), querying and indexing statistics aggregated with high resource utilization rates such as JVM heap memory may place a burden on the system and cause failure. As the utilization of Elasticsearch increases, the use cases requested by the business increase, and query and index design optimization becomes important. Also, depending on the use case, the demands of the business for data recovery and consistency may be intensifying. Hence, it is necessary to consider utilizing an external specialized technical service that helps smooth use and operation management of Elasticsearch, from index design in the early stage of system introduction to response to various requirements and problem solving. This not only improves the accuracy of search results, but also improves the indexing processing speed, enabling reliable management of large amounts of data.
S-Core is Korea's first Elasticsearch MSP (Managed Service Provider), and an expert organization composed of engineers certified by Elastic Co., Ltd. provides technical advice, problem solving, and carepack services in one stop.
Official release of private modification when upgrading
In line with the evolution of the IT environment, Elasticsearch is also upgrading its version accordingly. However, if some functions of the open source Elasticsearch are privately modified by the development/operation in the company for their own business needs and are not merged in the official product release, the privately modified functions cannot be used when the Elasticsearch version is upgraded, resulting in operational difficulties and malfunctions even though Elastic encourages users to contribute to the addition and improvement of functions.
It is highly recommended to use the officially issued code of the product without change, if possible, and if inevitable, the privately modified part is merged and available in the officially issued codes of the product to be applied by all means.
# References
[1] https://www.globalonlinetrainings.com/elk-stack-training/
[2] https://codingexplained.com/coding/elasticsearch/understanding-analysis-in-elasticsearch-analyzers
[3] https://www.elastic.co/blog/observability-with-the-elastic-stack
[4] https://www.elastic.co/blog/understanding-query-then-fetch-vs-dfs-query-then-fetch
[5] https://logz.io/blog/runkeeper-elk-stack/
[6] https://towardsdatascience.com/an-overview-on-elasticsearch-and-its-usage-e26df1d1d24a
[7] https://www.elastic.co/blog/implementing-hot-warm-cold-in-elasticsearch-with-index-lifecycle-management
[8] https://www.elastic.co/guide/en/kibana/current/tutorial-define-index.html
[9] https://www.elastic.co/guide/en/elasticsearch/reference/current/authorization.html
[10] https://www.elastic.co/guide/en/elasticsearch/reference/current/glossary.html
[11] https://www.elastic.co/guide/en/elasticsearch/reference/master/realms.html
[12] https://www.elastic.co/guide/en/kibana/current/development-security-rbac.html
[13] https://en.wikipedia.org/wiki/Webhook
[14] https://db-engines.com/en/ranking/search+engine
[15] https://trends.google.com/trends/explore?date=all&q=elasticsearch
[16] https://www.elastic.co/kr/customers/posco
[17] https://searchitchannel.techtarget.com/definition/managed-service-provider
[18] https://support.s-core.co.kr/hc/ko/categories/360000137273
▶ The contents are protected by copyrights laws and the copyrights are owned by the creator.
▶ Re-use or reproduction as well as commercial use of the contents without prior consent is strictly prohibited.

Elastic Support Engineer in Convergence SW group, S-Core
Responsible for Elastic Support as an Elastic Certified Engineer/Analyst
- CES 2025 Through the Eyes of a Samsung SDS Digital Marketer!
- An Agile Approach, the Core of Corporate DT for Working Culture Innovation
- Digital ESG, a Critical Success Factor for ESG
- Conversational AI War Begins. Who Will Be the Winner?
- What Is Matter, the New Smart Home Standard?
- 2023 Forecast for Technology Trends