
for reliable, transparent analysis and imagination suitable for the circumstances,
and we should let our imagination run wild to overcome obstacles
in smart ways through “organizational voluntary cooperation! ”
full of things we cannot perfectly anticipate, like the COVID-19 pandemic,
but something we can analyze depending on the conditions through the active behavioral field data
and respond with smart moves through organizational voluntary cooperation
via reliable and quick predictions.
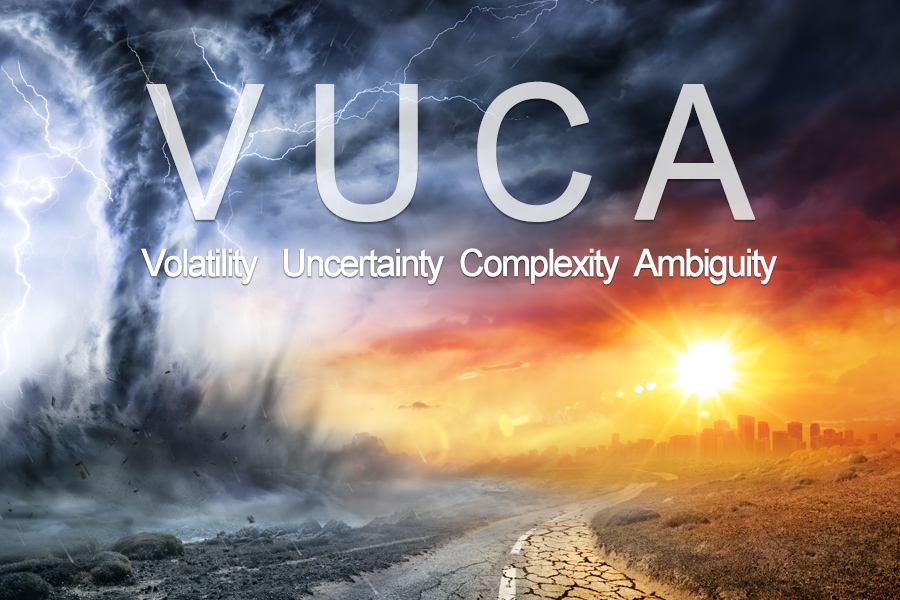
* VUCA: A newly-coined acronym which stands for Volatility, Uncertainty, Complexity, and Ambiguity, which refers to the current environment of unpredictability and hard-to-ensure future prosperity
 The VUCA World that we live in
How can we respond smartly to VUCA situations?
We are facing various types of VUCA situations, including the COVID-19 pandemic, more frequently. In addition to this, these situations lead to more complex and ambiguous problems, and require consilience*, expertise, and even the creativity of many people to solve complex problems. Meanwhile, the structure of the organization is increasingly individualized, segmented, and divided, leading to the conditions and structures of independent work. In particular, the COVID-19 pandemic brought physical and psychological separation and even life-threatening pain, and many efforts have been made to resolve it.
Let's then go through how to predict and respond smartly based on reliable interpretation and understanding (sensemaking*) of the possible issues we'll face in the upcoming VUCA World.
* Consilience: A word that regained its public recognition through the book, "Consilience, the Unity of Knowledge” by Edward Osborne Wilson, published in 1998. Its Latin etymology means “jumping together.” When the word was first introduced in Korea, the translator used Chinese characters with the meaning “grabbing two branches.” Wilson forecasts that scholarship will be divided into the natural sciences and humanities, and social science will be absorbed into biology and the humanities, and says the great challenge of human understanding to merge science and humanities will continue
* Sensemaking: Chair professor Karl Weick at the Ross School of Business of the University of Michigan defines sensemaking as letting various phenomena in an organization “make sense,” and says that in business, sensemaking is the process of creating awareness, providing a clear understanding of uncertain and complex situations inside and outside of an organization, and responding with understanding
Action steps for smart responses to VUCA World-driven issues via design thinking!
① Look for shared issues
② Collect active field data
③ Perform reliable analysis/diagnosis
④ Predict sensible conditions and issues
⑤ Respond with organizational voluntary cooperation
One. Collect “real-time and active behavioral data!”
: Define active behavioral data not collected in the system and collect available forms of additional system log data and field records (pictures, words, and behaviors from the field)!
To let issues become sensible (sensemaking), it is important to collect behavioral data in the active field. Recorded data is “what already happened in the past!” That is, “the historical data.” Therefore, historical data alone falls short of “responding to a new phenomenon” in this rapidly changing VUCA World. We can understand and interpret past situations through data. However, we need “real-time, active data” to interpret current or future situations because they are important clues. Therefore, "active behavioral data" is merged with historical data to enable “transparent interpretation,” bringing “trust based on clear interpretation.”
These interpretations encourage those who suffer from the same difficulties and those who want to offer opinions as experts to solve problems together based on empathy.
What is "trustworthy interpretation"?
It suggests detailed problem-solving methods through "actionable insights” based on the experiences of participants and the expertise of experts and helps solve issues in smart ways through "(organizational voluntary cooperation*)” among members of organizations.
* Organizational voluntary cooperation: Professor Morton Hansen of UC Berkeley, an authority in organizational research, defines "What is cooperation? It is a behavior to achieve common goals and show performance through the communication and cooperation of stakeholders.”
* Organizational sentiment of cooperation: A well-known expert on creativity, professor Teresa Amabile of Harvard University, emphasized that “A help culture in an organization brings multifaceted perspectives and experiences, and expertise for better quality and feasibility of ideas.”
→ “Collect active data” on the design thinking customer journey map!
* Customer journey map: A map with a visualized behavior flow in chronological order to help understand the journey before and after the phenomenon in questions that come up based on context. It is used to identify when issues occur that everyone will understand and trust and understand the context before and after issues.
A customer journey map can help you make reasonable understanding based on the context to ensure you can understand issues with trust and empathy. The map is one of the design thinking methodologies and an important treasure map to find clues for problem-solving with “real-time, active behavioral data obtained in the field.”
The map is sometimes used to understand the context of the current issue or to persuade related stakeholders and experts in the fields to engage in finding out and solving the root causes with the improved customer journey map, which will bring about organizational voluntary cooperation.
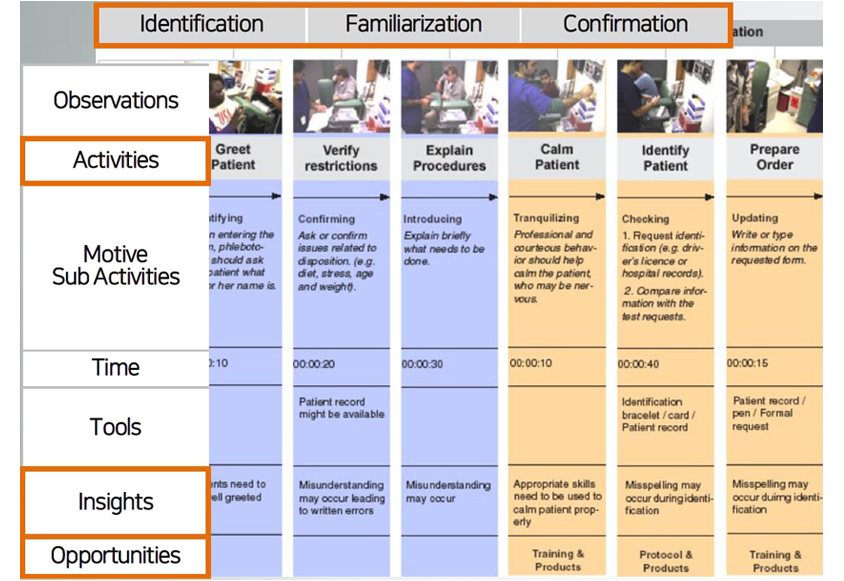
- Observations
- Activities
- Motive Sub Activities
- Time
- Tools
- Insights
- Opportunities
- Observations
- Activities -verify restrictions/explain procedures
- Motive Sub Activities - confirming ask or confirm issues related to disposition(e.g diet, stress,age and weight)/introducing explain briefly what needs to be done
- Time - 00:00:20/00:00:30
- Tools - patient record might be available/
- Insights -misunderstanding may occur leading to written errors/misunderstanding may occur
- Opportunities
- Observations
- Activities - calm patient/indentify patient/prepare order
- Motive Sub Activities - tranquitizing professional and courteous behavior should help calm the patient,who may be nervous/checking 1.request identification(e.g. driver's license or hospital record0 2.compare information with the test requests/updating write or type information on the requested form
- Time - 00:00:10/00:00:40/00:00:15
- Tools - /indentification bracelet ,card,patient record/patient record,pen,formal request
- Insights - apporopriate skills need to be used to calm patient properly/misspelling may occur during identication/ may occur during identification
- Opportunities - training & products/protocol & procucts/training & products
There are many ways to depict the customer journey. One of the ways is taking a picture of the customers' difficulties and using them in the journey mapping. This method is advantageous in that it helps you directly witness the actual pain of the customer as if listening to the real voice of the customer, so it is possible to quickly draw empathy and trust from those who participated in the project with qualitative data from the field.
Organize the pictures chronologically with notes on behaviors, their motives, purposes, tools used, touch points, insights gained during observation, potential improvement opportunities, and possible stakeholders to cooperate with in detail.
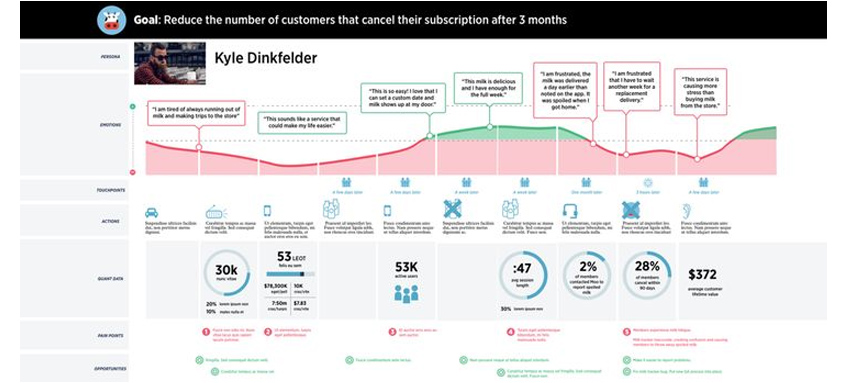 The 2nd way of collecting vivid experience data – Record changes in quantitative data brought by customer behavior in chronological order
Another way to draw the customer journey map is applying quantitative data with behavioral changes of customers on the journey map in chronological order. This is useful for understanding the situation of changes in behaviors and customers' feelings. For example, the journey map is very useful for understanding thoroughly, focusing on backgrounds and outcomes, including what services led to subscription or unsubscription, and why such behaviors occurred.
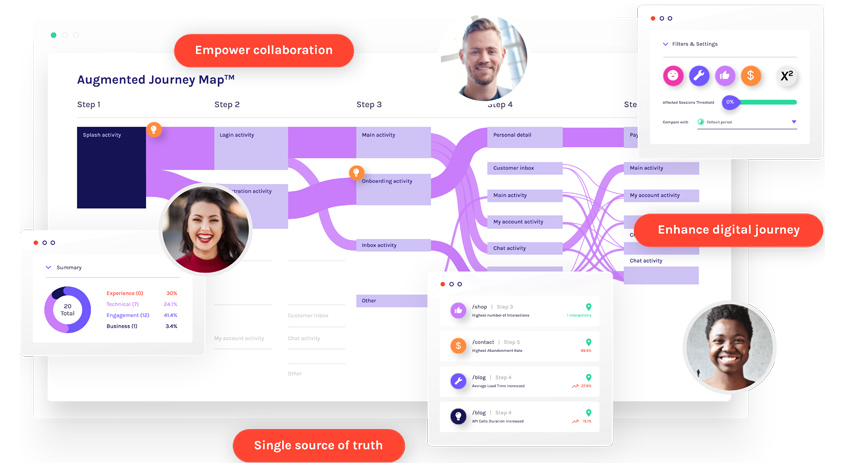 The 3rd way of collecting vivid experience data – Record digital footprints brought by customer behavior in chronological order
Another way to draw customer journey maps is digital footprints that contain records of changes in customer behavior. This method is useful for figuring out movements in invisible digital space, the main causes, and what phenomena are caused. For example, the kidults (a portmanteau word of kid and adult) with specific tastes remain nostalgic about childhood experiences and want to feel those experiences again. Through the purchase records of targeted services in fashion, accessories, and props, we can figure out who is a 'kidult,' their changing interests, and their lifestyle.
Two. Sensemaking analysis based on “real-time, active behavioral data!”
: We cannot see our future perfectly. But solve issues by using "live behavioral data from the field!”
Analyzing customer behavior based on customer journeys allows us to find the clue to predict previous and future customer behaviors and offer better experiences and services. The reason behind analyzing customer behavior is to value the meaning of the behavior. The method finds certain parameters for certain behaviors, removes negative factors in those behaviors, and acquiring changes in the customer journey to awareness, experience, impression, feeling, comparison, decision, choice, expansion, and advocacy. Therefore, it is very important to analyze and interpret customer behavior, which is the customer journey, into reliable findings and find the right response and improvements. Customer behavior in detail includes various customer journeys, such as awareness, education, consideration, purchase, adoption, retention, expansion, advocacy, etc. We find special patterns in each step and analyze them to find and use the source data to remove difficulties and provide better customer service.
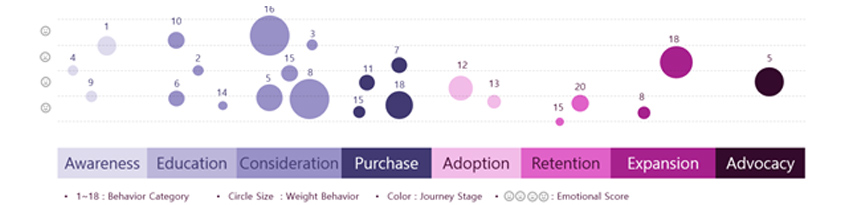
- awareness - 1,4,9
- education -10,2,6,14
- consideration - 16,3,15,5,8
- purchase - 7,11,18,15
- adoption - 12,13
- retention - 20,15
- expansion - 18,8
- advocacy - 5
- 1~18:behavior category, circle size:weight behavior,color:journey stage,emoticon:emotional score
Also, we can use the Shapley Value model to analyze the influence of the factors on behavioral patterns and solve the issues more intuitively with reliable interpretation. The SHapley Additive exPlanation (SHAP) model retraces the cause behind some phenomena and analyzes the intensity between such causes, allowing persuasive, convincing, and reliable explanations for each parameter. In addition, the black box model offers predictions for future behaviors.
[Note] Learn more about the SHAP analysis method
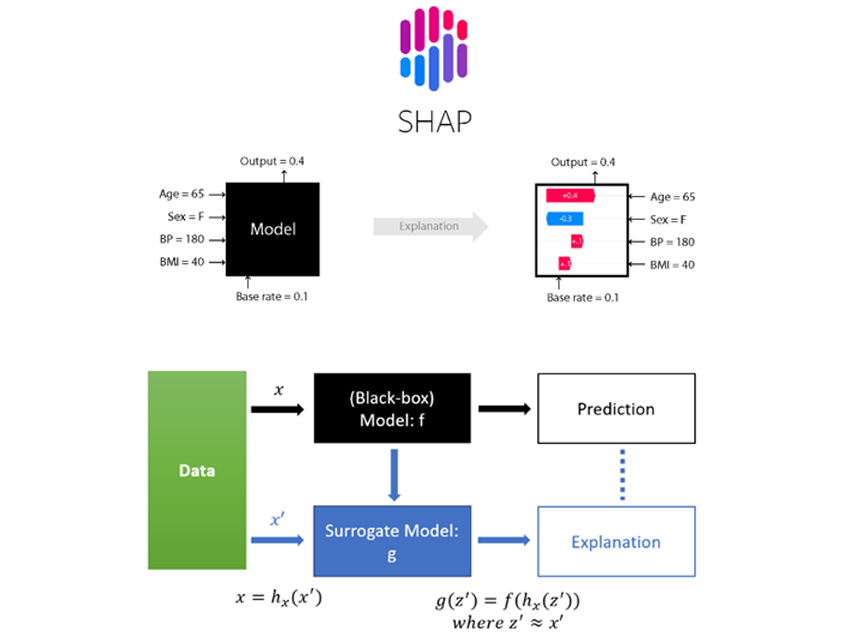
- age=65→,sex=f→,bp=180→,bmi=40→/base rate=0.1→Model→Output=0.4
- explanation
- base rate=0.1/age=65→,sex=f→,bp=180→,bmi=40→+0.4,-0.3,+.1,+.1→Output=0.4
- data
- →x/→x'
- (black-box)model:f/surrogate model:g
- →prediction/→expla]nation
- x=hx(x')/g(z')=f(hx(z')),where z'~x'
Collecting active data is surely important, but do not forget the importance of analyzing them. Smaller data is analyzed manually, but bigger data requires statistical analysis systems for easy and quick results. The table below presents an analysis of a certain project, visualizing the positive factors of the forecasts in red and the negative factors in blue. The positive factors affecting certain situations were explained by large capital loss, the higher and lower educational background of married people, the higher educational background of the elderly living alone, and the acquisition of huge capital. Negative factors were the lower educational background of young and middle-aged singles and the higher educational background of young singles. Other than demographic factor analysis, visualization of behavioral data is also possible. For example, customers may listen to or reject recommendations from store assistants or rely on search results on the internet or recommendations from their colleagues. These customer behaviors may have positive or negative effects and some direct or indirect influences on purchasing and help find ways for service improvements to provide a good customer purchase experience.
The behaviors help us get thorough analyses to extract and interpret explanatory factors on results or phenomena and predict what will happen in the future.
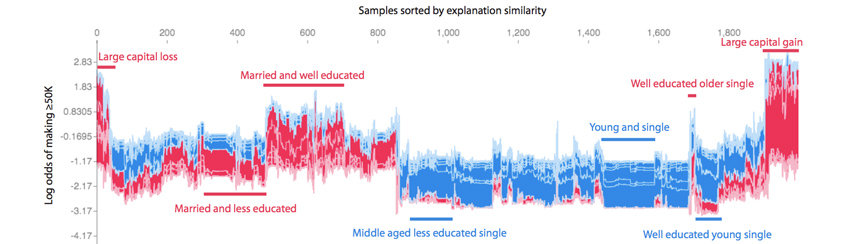
- large capital - loss log adds of making 250k :1.83
- married and less educated - loss log adds of making 250k :2.17
- married well educated - loss log adds of making 250k :0.8305
- middle aged less educated single - loss log adds of making 250k:-1.17
- young and single - loss log adds of making 250k:-1.17
- well educated young single - loss log adds of making 250k:0.8305
- well educated older single - loss log adds of making 250k:-1.17
- large capital gain - loss log adds of making 250k:2.83
In this issue, we have focused on “how to respond smartly in VUCA World!” to learn various ways to collect active data and visualize them on the customer journey map. In addition, we explained how to turn those data into persuasive and reliable analysis beyond understanding and convincing and to find a clue enabling organizational cooperation for improvement. Please remember that the most important thing is “collecting active customer data,” and how to find a clue to customer pain points depends on access to “active customer behaviors.”
I want you to realize customer-driven innovation through what you've learned in “How to respond smartly to VUCA World!”.
You can find how to seek innovative digital transformation through “people, first” philosophy in the previous article.
View more about past articles:
“Design thinking ⑩ - Start with “People, First” philosophy for successful digital transformation”
https://www.samsungsds.com/kr/insights/
Samsung SDS will endeavor to improve all customer experience moments and offer beloved innovative services and products. I will keep trying to innovate work culture to find new values customers want with design thinking and realize new technologies customers demand through digital transformation.

Until your vision comes true! Realize your vision!~
We will actualize digital transformation (DT) with design thinking (DT).
References
[1] Sensemaking
Karl Edward Weick: Chair Professor at Ross School of Business of University of Michigan
Sensemaking: Sensemaking in Organizations (Foundations for Organizational Science)
[2] Concilience
Edward Osborne Wilson: American sociobiologist, 1998
Consilience: The Unity of Knowledge: Edward Osborne Wilson
[3] Organizational voluntary cooperation
Morten Hansen: Professor of business at School of Information, University of California, Berkeley, and professor at INCEAD), 2009
Collaboration: How Leaders Avoid the Traps, Build Common Ground, and Reap Big Results
https://www.ischool.berkeley.edu/people/morten-hansen
[4] cooperative organizational commitment
Teresa M. Amabile: Professor at Business School of Harvard University, 1996
Creativity In Context: Update To The Social Psychology Of Creativity
[5] Customer journey map using pictures
http://wwwdev.kmooc.kr/asset-v1:SNUk+SNU061.020k+2020+type@asset+block@_학습자료__인간_중심_성찰과_디자인_3주차.pdf
[6] Customer journey map using recorded quantitative data
https://ar.pinterest.com/pin/245798092148386652/amp_client_id=CLIENT_ID(_)&mweb_unauth_id=&simplified=true
[7] Digital footprints of customer behavioral data on customer journey map
https://www.glassbox.com/visualize-user-journey-mapping/#journeymapping
https://www.beusable.net/blog/?p=3264
[8] Customer journey map using grouped behavioral patterns data for each journey
https://kimiae.tistory.com/m/29
[9] Data analysis to explain factors of customer behaviors
https://velog.io/@tobigs_xai/2%EC%A3%BC%EC%B0%A8-SHAP-SHapley-Additive-exPlanation
[10] 고객행동에 영향을 미친 긍부정요인 설명 가능한 데이터 분석
https://github.com/slundberg/shap/issues/309
▶ The content is protected by the copyright law and the copyright belongs to the author.
▶ The content is prohibited to copy or quote without the author's permission.
- #DESIGNTHINKING
- #DIGITALTRANSFORMATION
- #DESIGNSTRATEGIES
- #INNOVATEWORKCULTURE
- #INNOVATECUSTOMEREXPERIENCE
- #INNOVATECUSTOMERVALUES
- #CUSTOMEREMPATHYMAP
- #SAMSUNGSDS
- #DESIGNTHINKINGTOOVERCOMECOVID-19PANDEMIC

Received her Ph.D. degree in experience innovation design research from Hongik University and was certified in a design thinking expert course at Domus Academy Milano, and professional skill training at an engine service design company in the UK. Currently, she runs a corporate design thinking study group as an SCP, and endeavors to spread innovative design thinking-based work culture on the CX Innovation Team, Development Center, with her innovative cell team members.